SIP Performance: A 30-Year Analysis of Negative Returns
Market Volatility and SIP Returns: A Long-Term Perspective
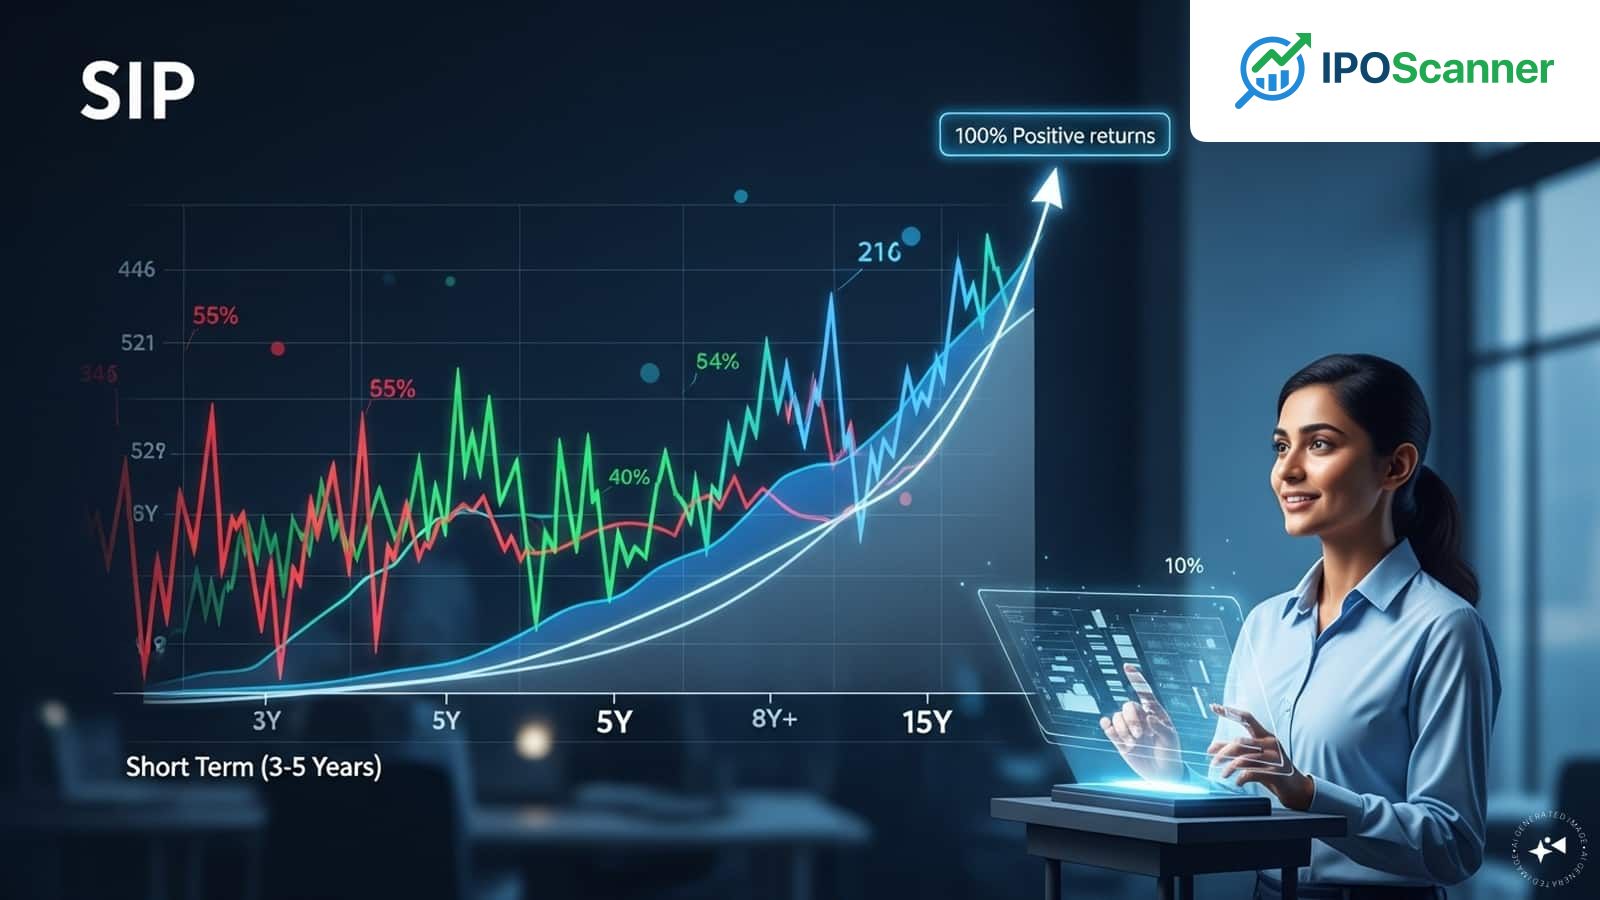
Investors often start systematic investment plans (SIPs) with the belief that "if you stay invested long enough, markets eventually reward you." However, the question remains: how long is "long enough"? A recent WhiteOak Capital Mutual Fund SIP Analysis Report (May 2026) sheds light on this query by examining the rolling SIP returns on the BSE Sensex TRI.
The report reveals that even SIPs for shorter periods, such as three years, come with the risk of losing money despite systematic investment through market ups and downs. In fact, three-year SIPs delivered negative returns in 12 percent of historical observations between August 1996 and April 2026, with the worst outcome being a steep -24.59 percent return. Five-year SIPs were not completely safe either, with some periods showing returns as low as -9.48 percent.
However, the picture changes dramatically with time. The eight-year mark appears to be a turning point, as SIPs held for eight years or longer never delivered negative returns historically during the analyzed period. This consistency extends to longer investment horizons, including eight, 10, 12, and 15-year SIP periods, all of which showed positive returns across every rolling observation in the dataset.
Read also: Treasury Yields Experience Largest Increase in Two Weeks Following Release of Labor Market Data
While longer SIPs did not eliminate volatility overnight, they did steadily reduce the probability of bad outcomes. The worst-case outcomes also became meaningfully better as investment horizons increased. For instance, the minimum return for eight-year SIPs improved to 3.03 percent, and for 15-year SIPs, it rose to 7.3 percent.
Interestingly, the highest SIP returns actually came from shorter investment periods, with the maximum return for a three-year SIP standing at 55.56 percent. However, these shorter periods also came with far wider swings. As the investment duration increased, returns became narrower and more predictable, with average SIP returns across tenures largely staying in the 14-16 percent range.
The data also shows that consistency is built by surviving enough time in the market, rather than by timing it. The probability of earning double-digit returns increased significantly with longer investment periods, with a 98 percent success rate for 12 and 15 years, compared to 67 percent for three-year SIPs.
SIP Returns Comparison
Read also: US-Iran Tensions Spark Uptick in Oil Prices Amid Global Market Decline
| Investment Period | Highest Return | Worst Return | Average Return |
|---|---|---|---|
| 3 years | 55.56% | -24.59% | 14.23% |
| 5 years | 34.69% | -9.48% | 14.56% |
| 8 years | 20.59% | 3.03% | 15.13% |
| 12 years | 18.18% | 5.59% | 15.62% |
| 15 years | 18.18% | 7.30% | 15.92% |
The takeaway from the data is not that SIPs are "risk-free." They are not. However, SIP investing works differently, depending on the holding period. Over shorter durations, market timing and volatility still matter, while over longer periods, odds heavily favor investors.
Investor Takeaway
Investors should be aware that SIPs may not always guarantee positive returns, especially in the short term.
More in Economy

Treasury Yields Experience Largest Increase in Two Weeks Following Release of Labor Market Data

US-Iran Tensions Spark Uptick in Oil Prices Amid Global Market Decline

MoSPI Releases Uniform Norms for DDP Estimates with 2022-23 Base Year