Puravankara Shares Post 17% One-Day Gain Following March Quarter Business Update
Puravankara Shares Surge 17.3% Amid Robust Q4 Performance
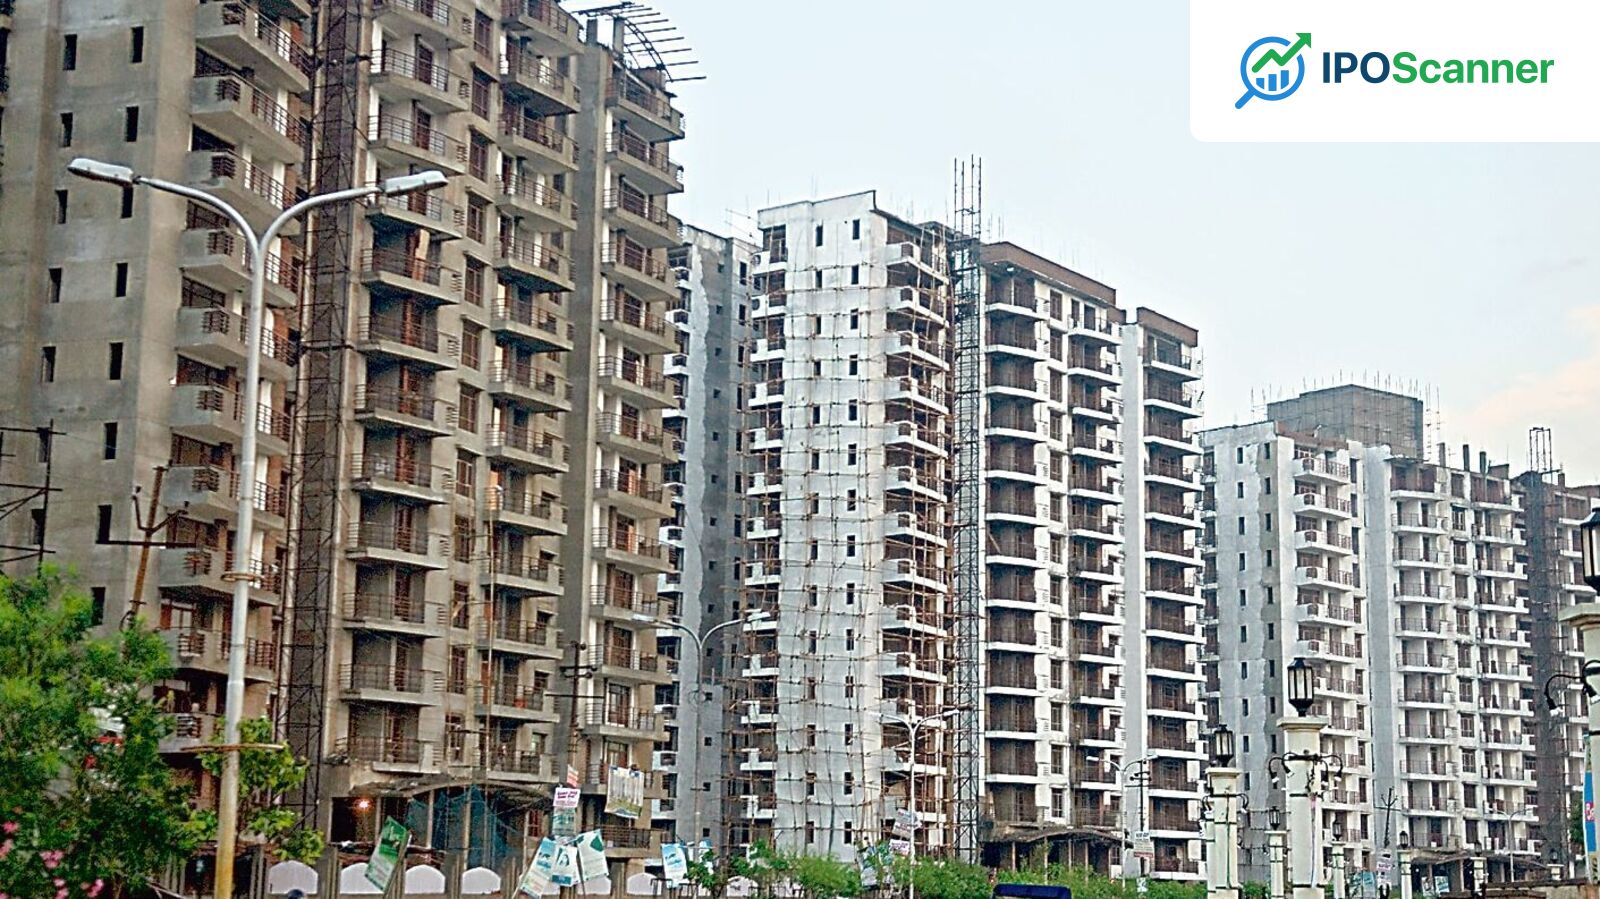
Puravankara, a leading real estate developer in India, saw its shares jump 17.3% during Monday's trading session on April 13, as investors responded positively to the company's March quarter business update. This marked the company's biggest intraday gain in two years.
The company released its update during market hours today, reporting a robust 190% jump in sales to ₹3,547 crore. In the same period last year, it had reported total sales of ₹1,225 crore. This significant increase in sales demonstrates the company's growing presence in the Indian real estate market.
In terms of collections, the company posted a 36% increase to ₹1,213 crore, compared with ₹892 crore in the corresponding period last year. This increase in collections highlights the company's ability to manage its cash flow effectively.
Read also: Treasury Yields Experience Largest Increase in Two Weeks Following Release of Labor Market Data
For the fiscal year ended March 31, 2026, the company recorded total sales of ₹7,407 crore, up 55% from the previous fiscal. Customer collections stood at ₹4,258 crore, up 15% from ₹3,711 crore in FY25.
The company's average price realisation increased by 21% to ₹10,213 per sq ft during FY26, compared with ₹8,436 per sq ft in FY25. This significant increase in average price realisation is a testament to the company's ability to deliver high-quality projects that command premium prices.
Furthermore, the company said it handed over 1,301 homes totalling 1.67 million square feet during the quarter, taking the cumulative handover for FY26 to 3,747 homes, or 4.25 million square feet.
| Fiscal Year | Total Sales (₹ crore) | Customer Collections (₹ crore) | Average Price Realisation (₹ per sq ft) |
|---|---|---|---|
| FY25 | 1,225 | 892 | 8,436 |
| FY26 | 3,547 | 1,213 | 10,213 |
Read also: US-Iran Tensions Spark Uptick in Oil Prices Amid Global Market Decline
The company's growth pipeline has been strengthened by the addition of 13.6 million square feet with an estimated GDV of ₹15,200 crore. The company has also launched new projects in Bengaluru, Mumbai, Kochi, and Pune, alongside new phases of existing projects, with a total saleable area of 6.39 million square feet.
Puravankara's share price trend has been upward in April, but the stock remains far below its one-year highs, having come under severe selling pressure in recent months. The stock has closed in the red for each of the last five months, losing 38% during this period.
Investor Takeaway
Investors responded positively to Puravankara's March quarter business update, leading to a 17% one-day gain in shares.
More in Market

Treasury Yields Experience Largest Increase in Two Weeks Following Release of Labor Market Data

US-Iran Tensions Spark Uptick in Oil Prices Amid Global Market Decline

Indian Stocks to Watch: BHEL, Agarwal Industrial, JBM Auto, Rajesh Exports, Indian Energy Exchange, Lenskart Solutions in Market Focus on June 4.
